The 8-channel Scope provides real-time visual feedback from the controller in the form of an oscilloscope. Any data Source from Watch may be chosen to view on the Scope and up to 8 different Sources can be displayed simultaneously. This not only allows the user to see analog values such as torque or velocity, but also Boolean values such as digital inputs and outputs (set Scale near 1 when scoping Booleans).
There are many configuration options for the Scope tool (outlined below), and the Galil Project will automatically remember the settings from one GalilTools launch to the next.
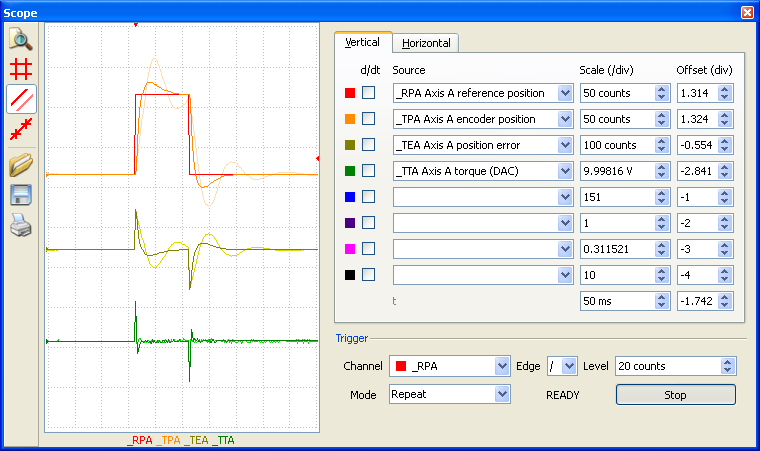
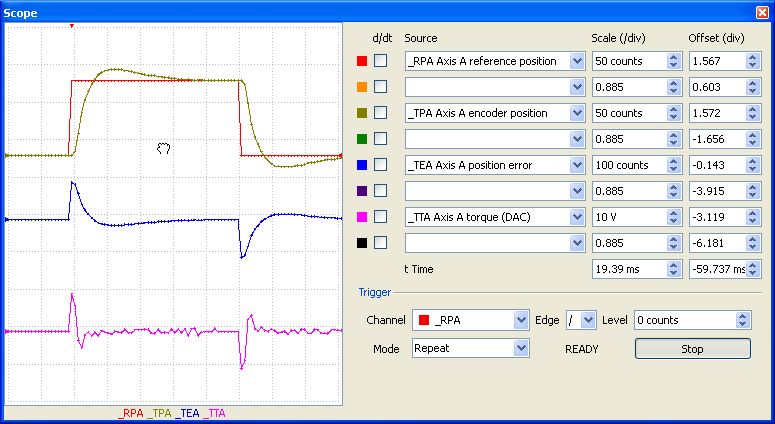
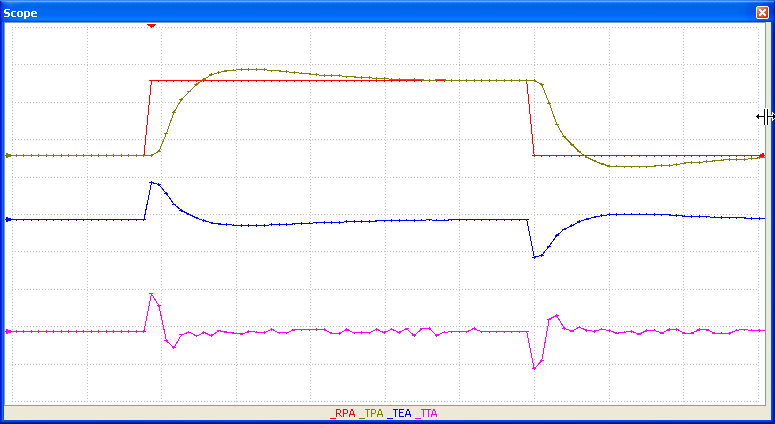
Hint: One very important distinction is that although only up to 8 channels can be displayed on the Scope at one time, all of the data record (typically hundreds of Sources) is recorded. This means that for a particular capture, if a desired Source is not present on the Scope, the user need only select that Source for one of the channels and the recorded data will then be displayed (see critically damped example below).
Hint: Use the refresh button (F5) in the toolbar to refresh the connection if you change the configuration of AQ,DQ,TM,CO, and BA.
|
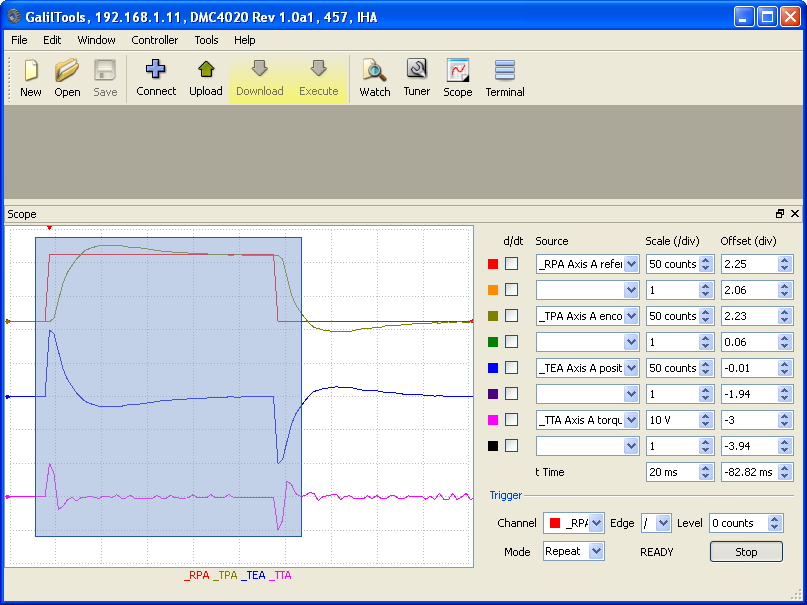
| 8 Channel Scope |
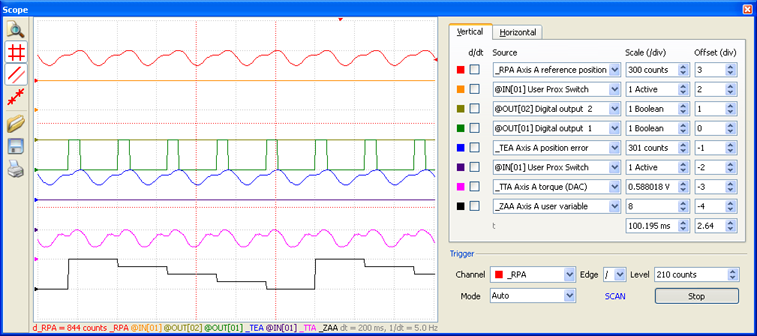
The Scope is divided into two sections: the toolbar, grid and traces on the left and the Sources, Scales, Offsets, and Trigger condition on the right. The distance between two grid lines is a division (div) and a channel's Scale represents the range of one division. The Offset arrows on the left represent the channels' zero ("ground") locations and can be adjusted to overlay or stack traces. The Scales and Offsets can be adjusted to provide the desired zoom and pan.
In normal operation, the 8 Sources are graphed against time. In this mode, the Horizontal tab is unused, and the horizontal domain is always time, scaled by a single "t" combo-box at the bottom of the sources list. Time can also be offset with the single time Offset combo box to the right of the time scale. All sources use the same time characteristics.
To graph a source against another source, the horizontal tab is employed. Changing the horizontal domain allows for up to 4 source-source graphs which are usefull for X-Y cartesian planes such as stages, and for two dimensional phase diagrams such as dual-axis error monitoring.
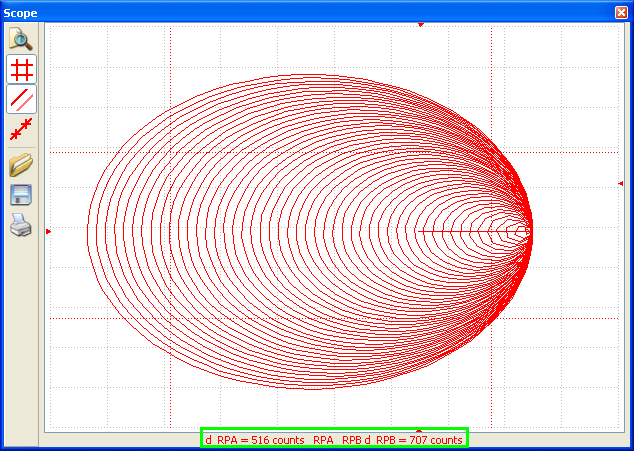 |
| The GalilTools scope allow X-Y plots. Here, the reference position of axis A is graphed verses axis B |
Note, by adjusting the time scale in the vertical tab, the length of time that is plotted can be changed. As for the vertical source, scale and offset of the horizontal source can be adjusted, under the horizontal tab.
The scope contains a wide variety of analytical tools. Tools can be found in the left-side toolbar, the right click menu in the scope grid, and in the Vertical tab. The vertical-horizontal data entry section and the toolbar can be made smaller and/or hidden by dragging the horizontal boundaries of the scope grid. The X-Y plot above shows the horizontal-vertical tabs hidden via this method to increase the rendered scope area.
By selecting the d/dt checkbox for a source, the discrete derivitive is performed. This is a one dimensional derivitive of the form:
T*(f(t) - f(t-1))
Where T is sampling frequency in Hertz and t is the sample.
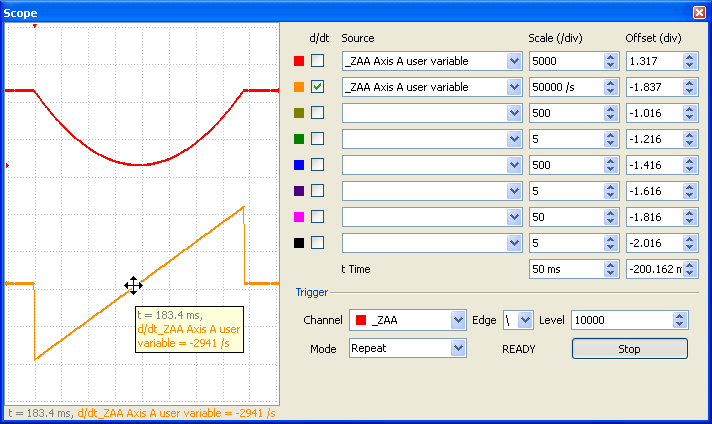 |
| The user variable ZAA forms a parabolic form over time [f(x)=x2]. The derivitive of this is a sloped line. [f1(x)=2x]. Note, the derivitive is in units per second. |
 |
| A jog (JG) move of 1024 c/s. The derivitive shows a constant speed. |
 |
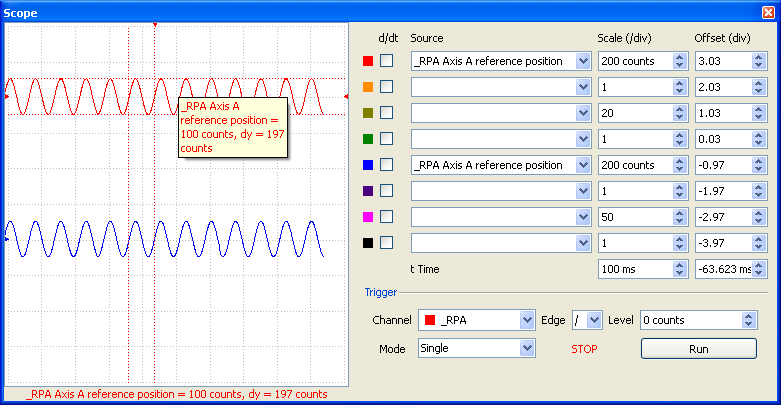
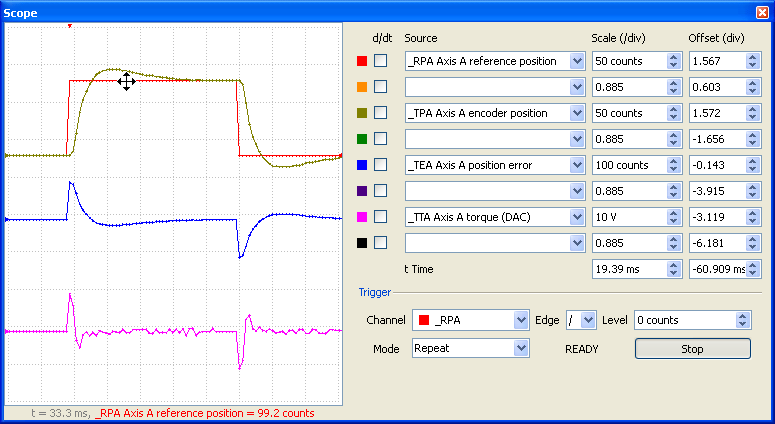
| Mousing over a cursor, a scope trace or an overlay trace will display pertinent data in the scope status bar and a popup tooltip. |
 |
| Mousing over a cursor displays cursor-specific data in a tooltip and the statusbar. |
The cursor references the active trace, selected by left clicking the trace in the scope field. The cursor color will reflect the active trace color. Trace location and delta values between traces are displayed in the status bar and tooltip.
Move cursors by clicking and dragging.
Scope overlay allows for traces from a previous scope capture to be compared to current waveforms. By clicking the overlay icon in the toolbar, the current scope traces are rendered in a lighter color in the scope background. Clicking the icon again will turn off the overlay, and the older data is lost.
 |
| Older data can be overlayed to compare with subsequent scope data. |
The Save icon in the toolbar exports the current scope data to a csv file.
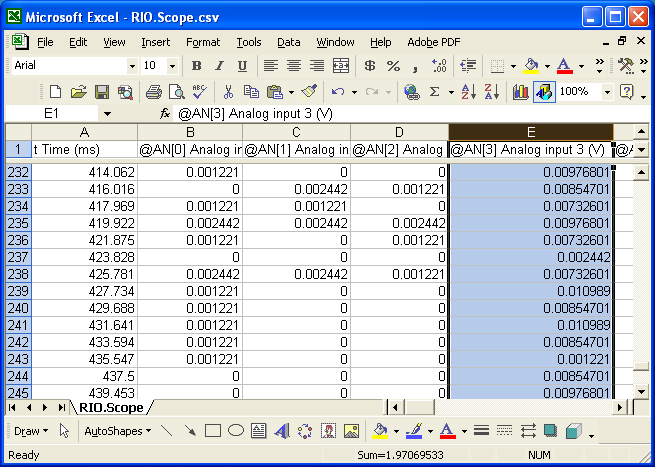 |
| Scope data can be saved to CSV from the toolbar. CSV can be easily imported into many third party softwares. |
The Open icon opens scope data into the scope as overlay data (background). This allows for previously saved data to be analized with the Scope's analytical tools and allows for comparison to current waveforms (foreground).
Clicking the toolbar print button will send the scope window to a printer.
 |
| Left clicking on the scope background allows two dimensional pan. |
 |
| Left clicking on a trace allows two dimensional pan: trace-only vertical, all traces horizontal. |
 |
| Clicking and dragging the toolbar's or control panel's scope boundary allows the scope grid to fill a larger section of the full scope window. |
By spinning the mouse scroll wheel when the mouse is over the scope background, all traces will be zoomed in or out. Both vertical scales and horizontal scales will be adjusted so that the zoom appears to be moving the viewer's perspective in or out (similar to moving the view camera in or out). Rolling the mouse wheel forward, towards the display, will zoom the view in. Moving away from the screen will zoom the view out.
When over a trace, the scrollwheel will zoom just that trace's scale. The time scaling is unmodified. This is useful for resizing one trace relative to another. Rolling forward zooms in, rolling away zooms out.
 |
| Ctrl + Left-Click allows a box region to be defined which will be zoomed upon click release. Esc escapes the box without zooming. Multiple zoom box operations can be undone with Ctrl + Right-Click. |
Zoom-box operations are also in the right click scope grid menu.
Clicking the Autoscale Icon in the toolbar will put the scope in Autoscale mode. In this mode, scales and offsets will be adjusted dynamically to keep the data on the scope, in-boundary and stacked. Click again to disable.
 |
| The Toolbar provides several scope-related options. |
| Icon (top to bottom) | Description |
|---|---|
| Autoscale | Dynamically keeps waveforms onscreen |
| Cursors | Turns on of off the cursors |
| Overlay | Turns on or off the Overlay feature |
| Points | Displays actual points used to render the waveforms |
| Open | Open dataset from CSV. Waveforms are rendered as overlays, in background. |
| Save | Saves current scope data to CSV. Saves data for all sources, not just displayed. |
| Print the Scope Window |
The Trigger menu at the bottom of the vertical tab can be applied to one of the 8 Scope channels on either a Rising or Falling Edge and allows the user to choose between three types of scanning modes common in oscilloscopes: Auto, Repeat, or Single. Auto will constantly display live data in the Scope window (useful to set the Trigger Level). Repeat will draw only after a Trigger and align the Trigger edge with the horizontal-offset arrow at the top (useful to catch the last of a series of triggers). Single will only capture the first triggered edge and will not refresh until the user clicks the Run button again (useful to catch the first of a series of triggers).
The scope has a status label to the left of the Run/Stop button which relays relevant information regarding trigger status. The following table describes the various states.
| Status | Meaning |
|---|---|
| STOP | Scope is stopped. If data has been captured, the data will stay drawn and static. Changing the Source in a channel will draw that data from memory. |
| ARMING... | The Scope is preparing to arm for Single or Repeat mode. No triggers will be detected. Data left of the Time offset is being buffered. |
| READY | The Scope is ready to detect a trigger condition. |
| TRIGGERED | The Scope has detected a trigger condition and is gathering data to fill the scope space right of the Time offset. |
| SCAN | When the Mode is Auto and the Time Scale is >= 100ms, the Scope is in Scan mode. Data is drawn continuously and triggers are ignored. |
For the following Ethernet and PCI controllers, the Scope sample period can be set with the DR command from the Terminal (see your controller's command reference): DMC-18x6, 21x3, 40x0, and RIO-471x0. GalilTools will automatically choose the fastest sampling period (DR) possible. For the DMC-18x2 QR is polled as quickly as possible, and the resulting sample rate may be uneven and depends on the controller and PC workload. For stand-alone controllers connected over RS-232, the scope uses the QR mode at a much slower sampling rate than DR over Ethernet. For increased scope performance on standalone controllers, Ethernet is recommended.